I always feel it’s important to maintain a healthy skepticism about things you hear or read.
So, I often also challenge myself about the thoughts and ideas I hold and put out there.
And that’s exactly what I did this week.
And now, I’m genuinely scared!
Because I think there is mounting evidence now to suggest that one of our major calls on a key component of the 18.6-year Real Estate Cycle is in danger of being wrong.
If that’s the case, history is about to change. This time might well be different.
And it does not bode well for our financial future either.
In this newsletter, I will take you through what I’ve uncovered today. And why, if it is true and does indeed play out, you need to fundamentally rethink what you are doing with your investments.
All of them.
Yes, it’s that important.
Read on now as I explain as simply as possible a scenario that threatens to turn the real estate cycle upside down!
King Dollar
I guess now you’re wondering what all the fuss is about.
I mean, on the surface, everything about the world economy seems steady, no immediate cause for concern. Besides, we can leave the uncertainty of the recent US elections behind us. On the surface, sure, I’d mostly agree.
What I am about to lay out here though is the big picture, something that will happen in the near future, rather than today.
I have not shared this chart I’m about to show with you before now.
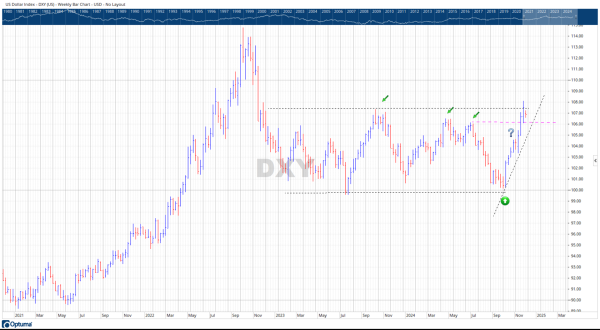
Source – Optuma
Forget about the chart of gold or of bitcoin: the above chart is the single most important chart in the world today.
The chart is of the US Dollar index (NYSE – DXY) which tracks the US Dollar (USD) against a basket of the world’s most important currencies. Click on the chart to open it in a new browser window. Then, please bear with me as I explain why I’ve marked the chart up the way I did.
The chart is dominated by 2 major technical patterns. On the left-hand side, you see the epic bull market of May 2021 to September 2022 as the US Fed viciously unwound their accommodative policies towards interest rates and instead slammed fully open the throttle named “interest rate rises”.
The second major feature is the inevitable retrace as the US Fed first signaled its intention to stop raising and then eventually began cutting rates. This resulted in a sideways channel that’s been almost 2 years in duration now.
I’ve marked this channel with two horizontal black lines. Near the top line I’ve marked three green arrows to show a number of lower highs. This was my first clue of the USD’s future movements. Why is this important?
Because the USD is the biggest single indicator for financial markets globally, its movements send important signals to private funds and government central banks everywhere. We have the further advantage of overlaying the knowledge of the 18.6-year Real Estate Cycle history to this.
Currencies freely trading against one another is a relatively new phenomenon (compared to the full 220-plus history of the cycle).
But once they did, from the early 1970s onwards, at this precise time in each preceding cycle, the USD has trended lower. Historically, this has supported a suite of commodities to move higher in price and facilitated more export trade opportunities for other countries.
Thus, those green arrows point to a number of lower highs, a technical sign of lower prices to come.
When prices hit the lower horizontal channel line and bounced, I opened this chart and inserted a question mark on the October 25th. The reason was I wanted to remind myself, next time I looked, that I was looking for yet another lower high to be confirmed.
Instead, prices continued higher, breaking through the pink horizontal line drawn from the last lower high. By doing so, this confirmed the trend had changed.
Prices were now expected to move higher in the future. As they did, subsequently breaking above the other lower highs too and then a brief rally above the upper channel line.
Folks, this I did not expect.
Because as I said, history tells us that the USD is supposed to be getting weaker at this moment in the cycle – not stronger.
The market is telling us that a strong move higher is expected. And this goes against history. The question, then, is why. And what it means for the remainder of this cycle.
This would be historic if it happened.
At times like these, its good to seek out other points of view, people that you can trust and have a strong track record.
Let’s look at the bigger picture.
Below is a longer-term chart from Cross Border Capital, a firm that specialises in looking at global liquidity flows. It is of the USD but adjusted for the balance of trade in the world.
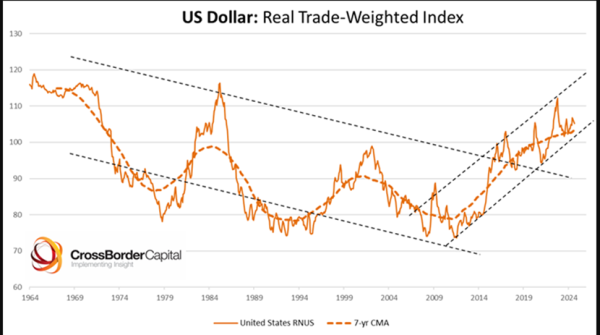 Source – Cross Border Capital
From 1964 to around 2009, the downward channel showed that the overall direction of the USD on a trade-weighted basis was downwards. Further, it had periods of weakness that corresponded to the second half of the 18.6-year cycle.
This should be happening again at the current time.
However, since 2009, the right-hard upward sloping line suggests that the USD is strengthening.
Momentum is up, and strongly so. It reflects America’s underlying relative productivity performance and net shift of capital into US assets.
This is for several reasons. It could be because the fact that the US has become, since around 2009, the world’s largest energy producer. It also reflects the relative productivity of the American economy relative to others, in part driven by the roll out of AI.
Does it reflect what many are calling right now? The end of the dollar due to an “unsustainable” debt problem in the US? Does it tell you there is no confidence now in the USD and the world financial system is now scrambling out of the dollar and into alternate currencies like the yen and yuan?
It does not.
The power behind the US dollar lies in investment capital. Foreigners trust the US dollar. Major commodities are denominated in dollars. International banks do most of their business in US dollars. Regulators lean towards the US dollar. These are not temporary factors. Foreign capital has been flowing into the US technology sector for over a decade now.
And so today, it really does appear we have arrived at a crossroads.
If history were to repeat, then the USD would become weaker relative to other major currencies. This would stoke inflationary pressures into the economy and financial markets. This has been the expectations of the PSE team for some time. We have watched the 100-price level on the DXY chart for many years now.
A weaker dollar and higher inflation, particularly in speculative assets, are a hallmark of the last years of a real estate cycle peak.
What’s could be happening now is that the present momentum behind the USD becomes embedded.
But the strong USD turn out to be a disaster when the 18.6-year real estate cycle ends.
And this portends disaster of the US economy.
The coming collapse!
While there’s a chance our USD forecast will turn out to be wrong everything else is pointing to the fact that the cycle will repeat and repeat on time.
If that’s the case, what does a strong USD into the peak imply for how things will play out?
Well, if the US cannot weaken its dollar as a response to the crisis, it loses a key tool to inflate away its debts. That is not ideal because suddenly the trillions of dollars’ worth of budget deficits will seem insurmountable.
If this then causes a chain reaction that affects the US government that would undermine global confidence in the lynchpin in the financial system.
At a time when the world will be badly in need of it. It would make the collapse even worse than we’re expecting.
This is why, as a matter of huge importance, I am keeping a chart of the US dollar up to date.
If things continue as they are today all the way to the expected US land market peak later this decade, it’s likely we will experience a much different set of circumstances leading up to said peak, compared to last time.
Because if the US dollar has trouble in the land crisis, then it will fundamentally change the make-up of investment portfolios around the world. Including your own.
Now, I want to make one thing clear. It’s presently too early to say that this will play out this way.
But it IS a possibility. And therefore, I must watch things very carefully.
And allow me to make a broader point.
The key to knowing which possibility is likely to play out rests on your ability to ‘time’ the economy. When you know in advance what’s to come, and it does, you can put newsletters like this in their correct context.
I know very well what time it is in the cycle, but do you?
If not, well that simply must change, and it changes when you become our latest Boom Bust Bulletin (BBB) member.
Whether it’s via our vast archive section or each monthly edition, you’ll have the opportunity to immerse yourself in research dedicated to the study of the economy where land is placed at the centre of such research.
Discover the secrets behind why the real estate cycle lasts 18.6-years on average, why it repeats and how it unlocks the hidden order of the economy, and thus its unique timing. And allow yourself ample warning should things change.
Such lessons are found nowhere else, I can assure you. And all for just $4USD a month, incredible value!
I have presented today a scenario that we must take seriously. But always remember, the most important cycle on earth is not the US dollar cycle; it is the real estate cycle.
Once you learn its inherent timing, you too will be able to judge for yourself whether a deflationary dollar has made any difference to the cycle completing on time. And I’m confident that you’ll come away with the same conclusion as me.
Is it different this time? No. Nothing will stop the real estate cycle from completing on time.
Not even a rising US dollar.
But you will have to change the way you were planning on playing these last few years in the market. A period of deflation means more emphasis on defensive strategies that might have to include government bonds.
We are talking defensive stocks, one with preferably a high and sustainable dividend.
If you know your timing and understand how to track the cycle as it reaches its peak, you’ll have ample warning of what you need to do.
99% of all market participants won’t have any idea. Make that fact your own investment edge.
Besides, I could be completely wrong about this. And the USD does what it’s always done at this stage.
You’d like to know either way though, right?
Then sign up now.
Sign up now.


