


There are certain events that you can count on to repeat.
The sun will rise in the East and it will set in the West.
And apparently, the world will never stop building.
At least for our lifetime. But arguably ever.
The Property Sharemarket Economics (PSE) Team have constantly mentioned the role infrastructure will play as we leave behind the recessionary lows and continue to a real estate peak later this decade.
In fact, right now this infrastructure spend is a key indicator of where we are in the 18.6-year Real Estate Cycle. And where we are going next.
But frankly, until recently, even I did not fully comprehend the staggering numbers involved.
And I mean staggering.
Not just this cycle, but potentially every real estate cycle going forward!
Take a seat, you’ll need to sit down to comprehend what I’m about to tell you.
According to a recent report by architecture2030, the world is adding 1.5 million people to its cities every week.
And this is to continue for the foreseeable future.
More than 50% of all humans on earth are living in urban areas.
Then there is this, from the UN’s global status report 2017.
By 2060, the world is projected to add 230 billion square meters (2.5 trillion square feet) of buildings, or an area equal to the entire current global building stock.
Two and a half trillion square feet!
Let me help break that stat down for you.
This equates to adding a city the size of New York City to the earth every 34 days…
…for the next 40 years!
This is the real estate cycle in action.
Or, if you’re a fan of Disney’s “The Mandalorian” …. “This is the way.”
Now stop and think what the world will need to achieve this:
Credit, commodities, developers, construction workers.
And, most importantly, land. Lots and LOTS of land.
This is the one thing man cannot reproduce.
As usual though, the market was already pricing this in.
Look at the following graphs.
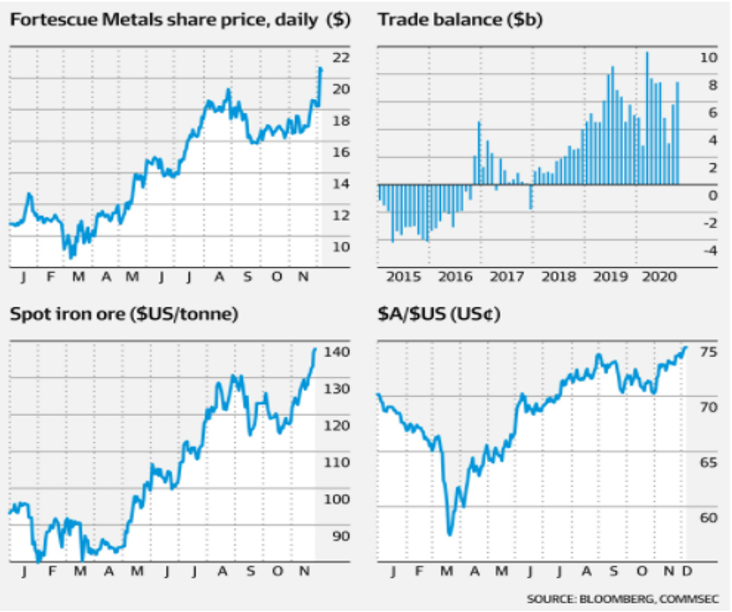
Source – Australian Financial Review
The trend for iron ore, listed stocks exposed to it, plus the ever-rising Australian dollar compared to the greenback, have combined to see iron ore prices hit seven-year highs.
The Property Sharemarket Economics (PSE) team study the 18.6-year Real Estate Cycle, 14 years up and 4 down with a mid-cycle recession (MCR) interrupting the 14 years’ expansion.
Now, this is the important bit.
It is easily missed by most.
The PSE teams research of the real estate cycle history suggested that property (or land) prices would not collapse during the MCR.
This assertion has proven correct.
Does this now mean that economies and stock markets around the world are fully behind their respective troubles with only blue skies ahead?
No. It does not.
Again, history suggested it would be in the stock markets and the broader economy where the real pain of this recession would be felt.
Our indicators all suggest further hurdles to overcome for both. If you are interested about finding more about this, click HERE.
What I am suggesting, per the above quotes and graphs, is a powerful alignment of two specific drivers which will in time generate incredible opportunities to profit.
The melding of the land price recovery and commodities closely tied to infrastructure. And this is the opportunity.
The timing of how the gains will manifest and, eventually, where they will go, all mapped out thanks to the 18.6-year Real Estate Cycle.
Right at the very start of this trend.
So, what should you do?
One of the best things to do, at the start of a long-term trend about to break out, is to compile a stock watchlist.
Here are a few ideas that can help you get started.
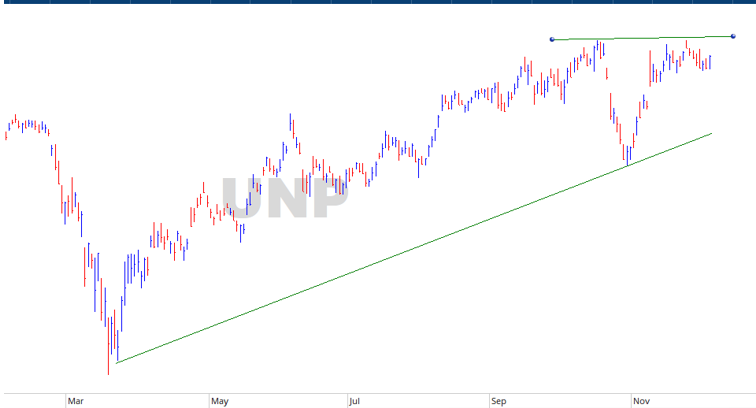
Source – Optuma
This is Union Pacific Corp (NYSE code – UNP). This is one of the US biggest railroad companies.
Not only is it benefitting indirectly from the US governments infrastructure related stimulus, but it also transports across the country many different products related to the building industry.
Things like oil, coal, sand, fertilizer, commodities etc.
As the infrastructure spend continues over the next few years, it will require more and more of the products this railroad company can transport.
Since March 2020, this stock has been on a tear.
It is now accumulating right below all time new highs. This is bullish.
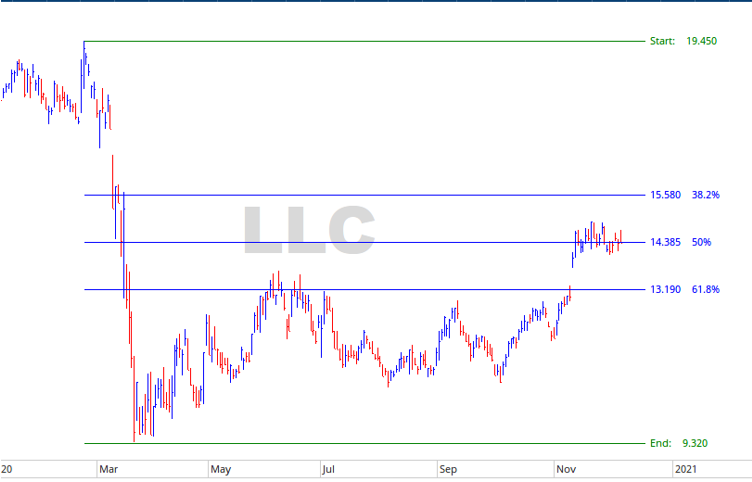
Source – Optuma
Lend Lease (ASX – LLC) provides property and infrastructure services across Australia, Asia, Europe, and the Americas.
This encompasses retail, retirement, commercial, defence, inner city mixed use etc.
Since the 21st February 2020 high of $19.45, the stock price fell to $9.34.
You can see on the right-hand side the price has reached the 50% level of that Feb/March range.
Should the price jump higher from here in the months to come it would indicate more good news (like infrastructure related contracts the company has won).
The ability to identify opportunities within the cycle as it progresses will be crucial to your own personal investment and trading strategy.
Tracking the cycle as it develops, such as building your own personal watchlist as one example, is important in identifying the timing of the 18.6 Real Estate Cycle.
And you can take the first step by subscribing to the Boom Bust Bulletin.
The Boom Bust Bulletin is the starting point in understanding the 18.6-year Real Estate Cycle, why it repeats, and how you can look for investment opportunities.
The information this bulletin provides is 100% exclusive to Property Sharemarket Economics.
And it will cost you less than a single coffee per month which is great value.
Click HERE to find out more.
Best wishes

Darren J Wilson
and your Property Sharemarket Economics Team