

If you would like to receive weekly updates like this, sign up here.
First off, please accept my apologies for not bringing you the usual Property Cycle Investor newsletter last week.
I needed to organize our 5th Boom Bust Bulletin webinar.
But now I’m back!.
And I bring you a message.
The reason for this is straightforward.
The mission statement for Property Sharemarket Economics (PSE) is this:
“Help our members to remember the future”.
So, today I will abide by that statement.
I will show you something today.
And it will prove to you beyond any question the importance of that mission statement.
Are you ready to see what the next three to four years in the stock markets will bring you?
Then read on.
It’s simply a matter of remembering.
I feel confident the simplicity of what I’m about to reveal will amaze you.
You will not even believe it could be this simple. After all, markets are complex and completely random, so the received wisdom goes.
Right?
And what about the talk of recession globally, and the weak economic situation of many advanced economies right now?
Inflation and rising interest rates can be put in that same basket too.
I know I’ve written to you all year about all these subjects.
But not today. For this newsletter, I am going to keep it very simple.
And here it is.
I will now show you the future for interest rates, stock markets and house prices.
You ready?
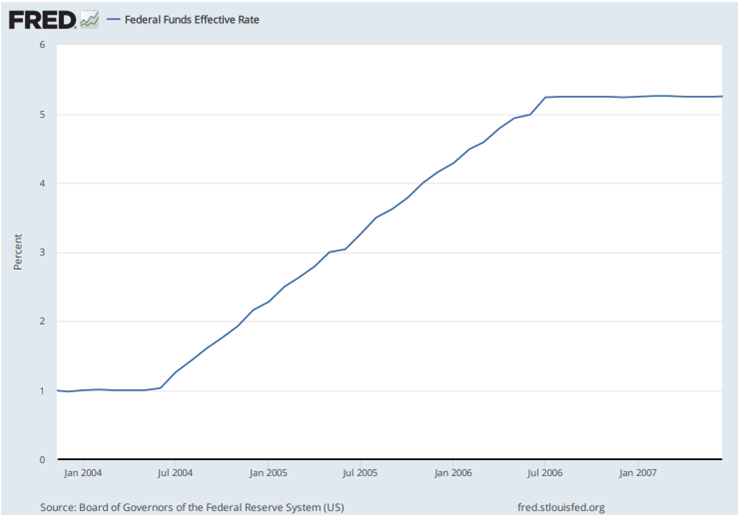
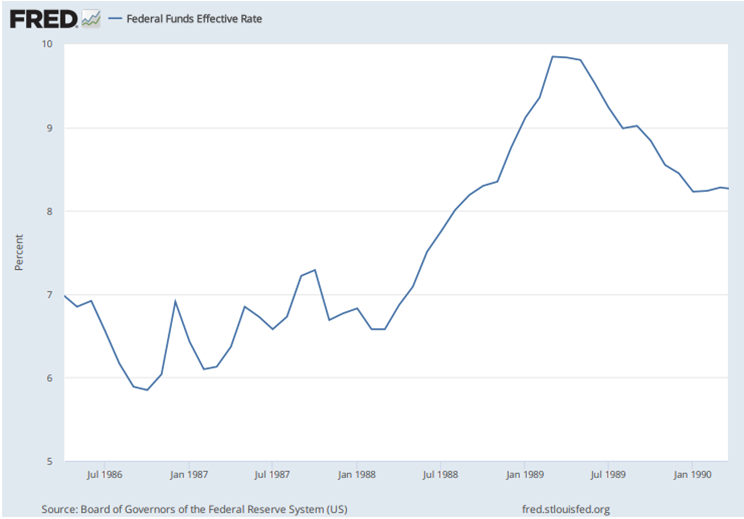
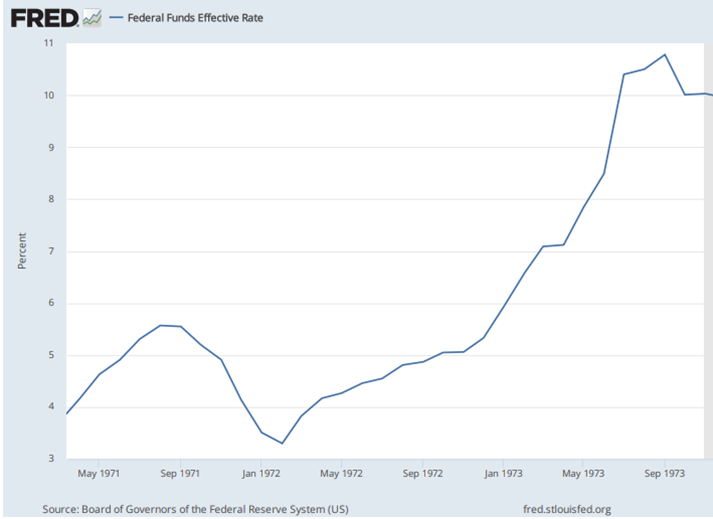
Source – Federal Reserve
Above is a chart of the US Federal Funds Effective Rate from January 2004 to March 2007.
The Federal Open Markets Committee (FOMC) sets the rate to guide overnight lending among U.S. banks.
This rate is one of the Federal Reserve’s key tools for guiding U.S. monetary policy.
It impacts everything from the interest you get on your savings to the rate you pay on credit card balances. It influences the mortgage rate on your home.
Which means the Fed Funds Rate effectively dictates the cost of money in the U.S. economy.
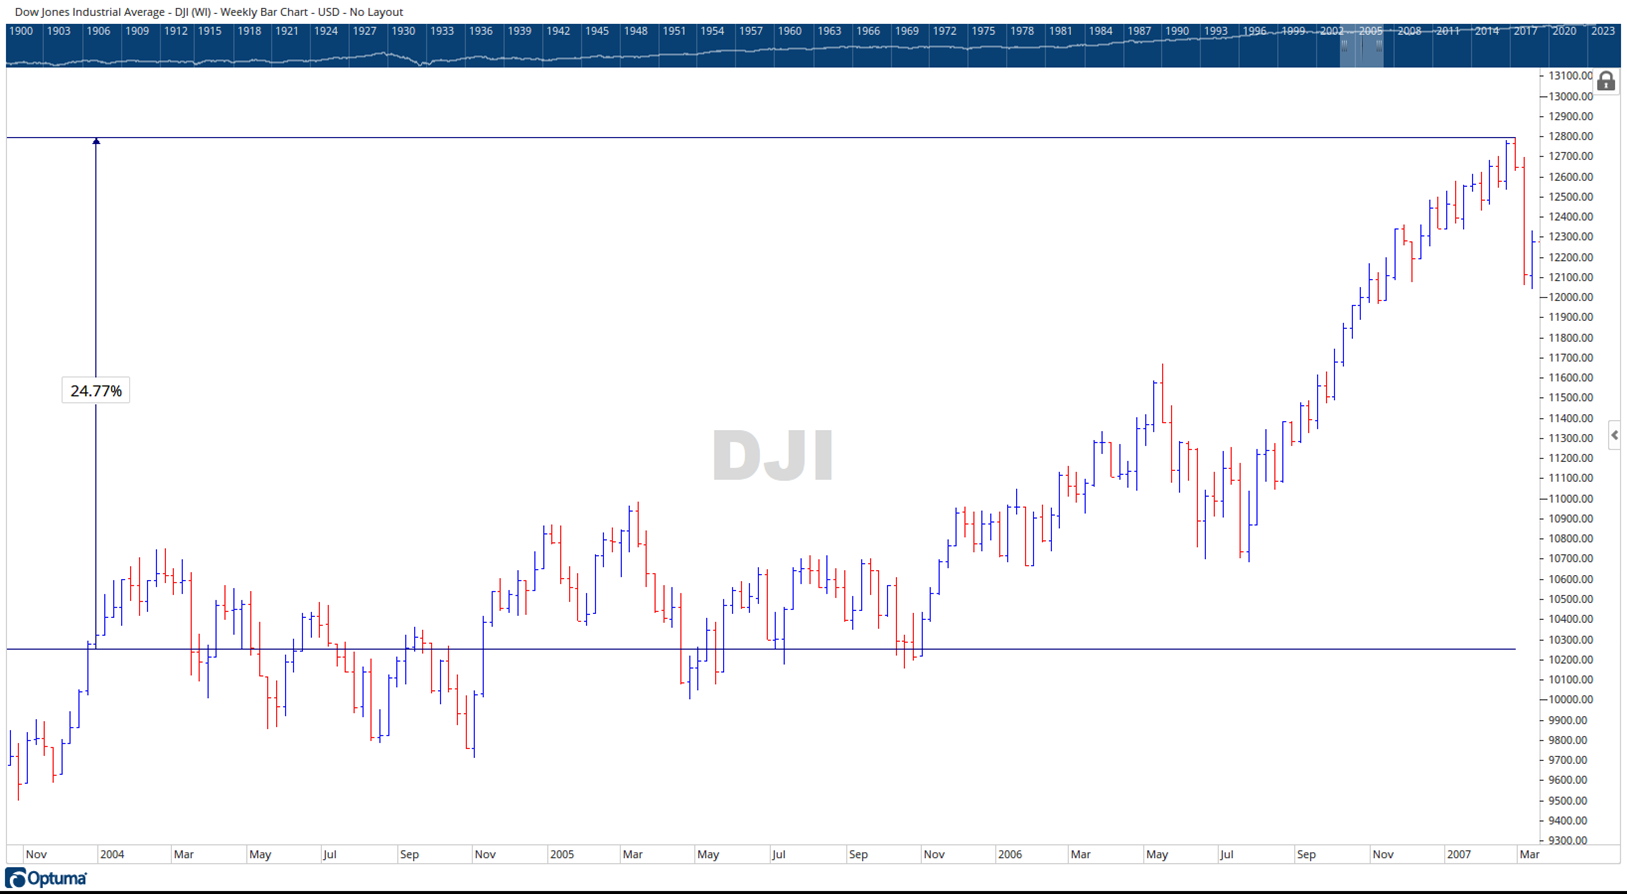
Source – Optuma
Above is the chart for the Dow Jones Industrial Averages (DJIA). (Click on the chart to open it in a new page). You can see that the index went up between January 2004 and March 2007.
Finally, we have a chart of median home sale prices in the US over the same period.
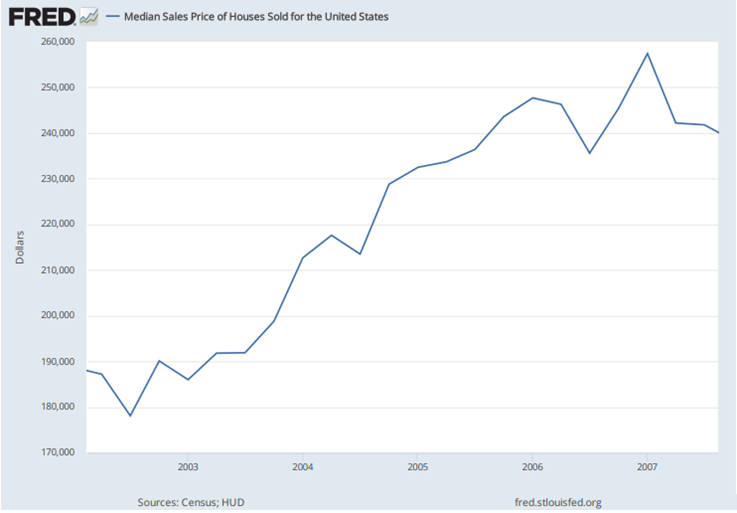
Source – Federal Reserve
Now, what can you see across those three charts?
They’re all rising at the same time. That is: interest rates are rising as are house prices and stock prices.
According to the experts, this can’t be done.
And yet, I’ve just shown you that it can.
Ladies and gentlemen, I give you, the future.
Why now is the time this really matters.
Those of you who are long-term readers of the Property Cycle Investor newsletters will know that this period covered the final years of the last 18.6-year Real Estate Cycle.
Which is where we are right now in the current one.
I can hear the pushback though. “Oh, that was just a confluence of events, a one off. It has never happened before or since”.
Ok then.
Here’s a chart of the Federal Funds Rate from July 1986 to January 1990.
Source – Federal Reserve
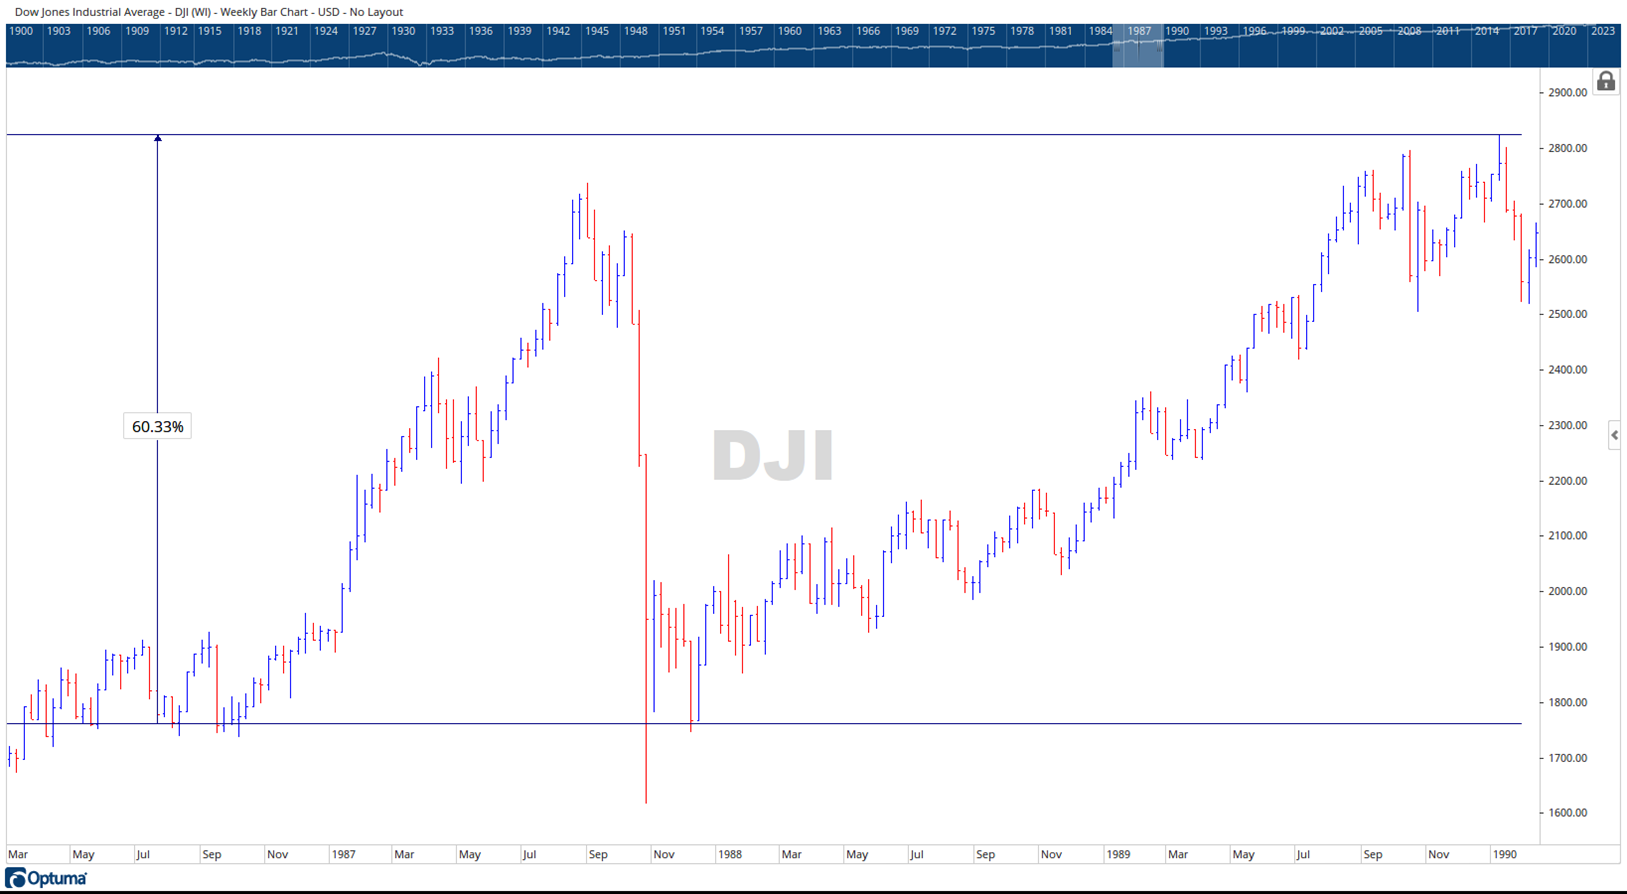
Source – Optuma
And here is the Dow Jones over that same period (click on the chart to open it in a new browser). The percentage return includes the now infamous October 1987 stock market crash. What we call the mid-cycle slowdown of that real estate cycle.
And finally, here are median house prices over that same period.
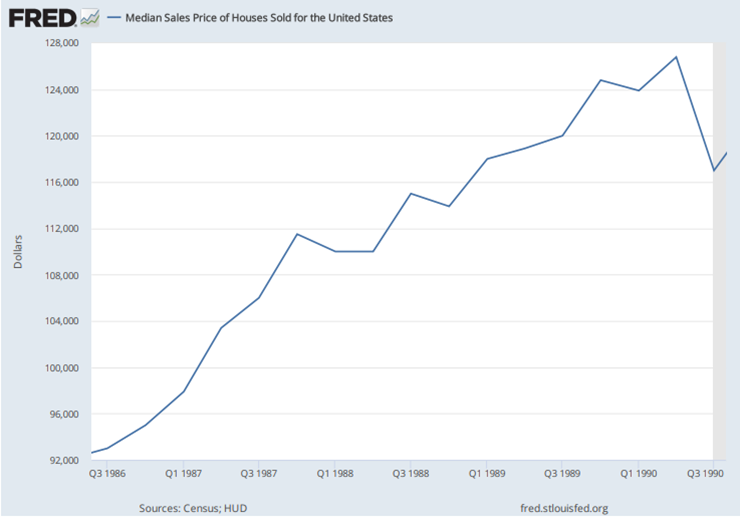
Source – Federal Reserve
A picture (well – a few charts actually) can say a thousand words, no?
The timing? The final few years of the 1974 to 1992 18.6-year Real Estate Cycle.
This is where we begin to run out of excuses to explain this.
Why, both today and in the past, do the world’s financial media and news reporting get this so badly wrong?
Again, the answer is rather plain and simple. They do not study and therefore understand the land market – and by extension the 18.6-year Real Estate Cycle.
The land market explains why interest rates, house prices and the stock market can all rise at the same time.
The land market can give you the timing of when this is due and provide advance warning of the incoming peak.
2023 was always an important year for our valued PSE members. They knew what kind of set-up we were forecasting. So far that is happening.
More importantly, though, are you ready? Don’t think by looking at these charts one simply has to go all in today and expect prices for everything to go ballistic.
The next few years will challenge all of us. It will be volatile, emotionally, and physically draining.
But no one will make the connections I have laid out here today to navigate all this emotion.
And if you remain ignorant of the cycle, you will follow it blindly, until FOMO drives you to jump into the market, going all in, at what we at PSE call the Winner’s Curse phase of the cycle.
Another term we use is “Mania”.
This is the worst time to overleverage and buy.
And why do we think it could happen to you? Because in every past cycle this is precisely what people do. Right close to the top.
There will be a year when things seem to go well. Maybe two years.
And then the crash happens. And people get completely wiped out.
I saw it happen in 2007 and 2008. To family members no less.
But I know it’s not going to happen to you this time around.
Because you’ll be our newest Boom Bust Bulletin (BBB) member.
You are going to give me the opportunity to take you in depth into the cycle.
You are going to learn about the history of both the 18.6-year Real Estate Cycle and the real reasons why interest rate rises, house prices, and stock markets are so indelibly linked.
Once you know this you will be able to decipher the news that we get bombarded with every day to focus solely on what truly matters.
No more negativity and noise, just the science of the economic rent and the timing inherent in the real estate cycle.
This is all you need to succeed in to take advantage of the rise in asset prices and avoid a crash.
A final note about how news is reported. There is a chart above that shows the Dow Jones Index from 2002 to 2007 . Here it is below.
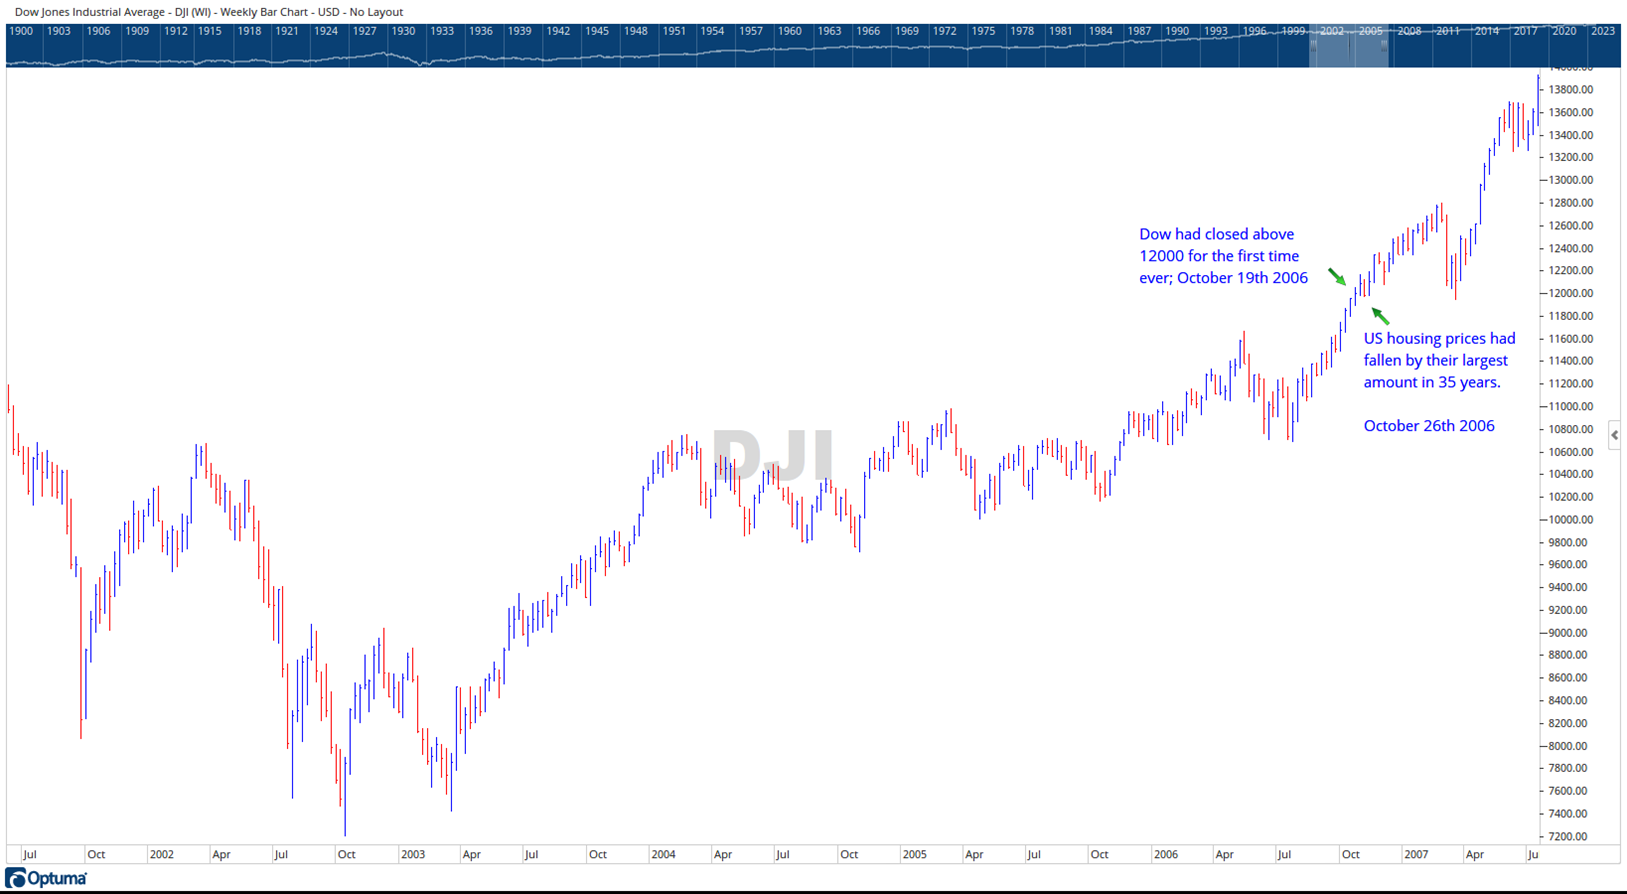
Source – Optuma
On October 19th, 2006, the world media loudly proclaimed the Dow had closed above 12000 for the first time ever.
One week later, on October 26th, to little coverage and eliciting barely a shrug from investors, a report stated that US housing prices had fallen by their largest amount in 35 years. No one paid the slightest bit of attention.
And so, it goes. See the fact the market continued higher? What happened 12 months later? What announcement do you think was providing early warning of it?
At the peak you will hear the hype. You won’t hear the warning signs, though. At the bottom you’ll hear all the warnings. But not the see the opportunity.
This is how the cycle works.
It’s imperative you remain neutral on the news and laser focused on what’s important for your safety in the markets.
That’s how the BBB can help.
As a Boom Bust Bulletin member you will receive a long-form newsletter every month detailing all the key turning points of the cycle, a deep dive into the most important markets across the globe and ways that you can personally benefit from this knowledge.
This derived from our unique and proprietary research – which you’ll not find anywhere else.
Plus, you’ll receive exclusive invites to BBB member-only webinars when we run them.
All this for just US $4 a month, less than a takeaway coffee.

Best wishes,

Darren J Wilson
and your Property Sharemarket Economics Team
Oh, ok…fine. One last chart.
P.S. – If you would like to receive weekly updates like this, sign up here.
P.P.S – Find us on Twitter here and go to our Facebook page here.
This content is not personal or general advice. If you are in doubt as to how to apply or even should be applying the content in this document to your own personal situation, we recommend you seek professional financial advice. Feel free to forward this email to any other person whom you think should read it.