


If you would like to receive weekly updates like this, sign up here.
Welcome to the Land of Contradictions.
Formerly known as the Land “Down Under”.
It does now seem Australia’s left hand has no idea what its right hand is doing.
Here’s an example.
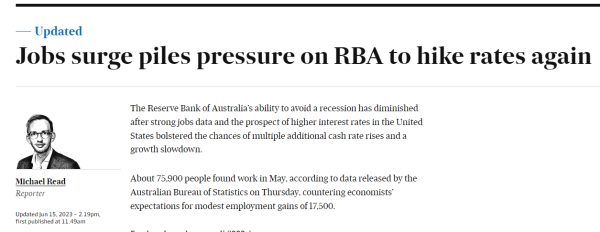
Source – AFR.
Rising employment? Well, that’s good news for the economy. Strong jobs numbers mean businesses are hiring, which means someone in the economy is digging out their wallets and spending.
So, enter Australia’s central bankers. What’s their move in this positive situation?
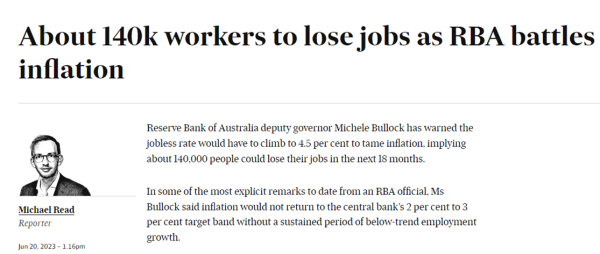
Source – AFR.
Wait…what? Is this how central bankers react to good news? By killing it?
Whisper it: do they have ANY clue as to what they are doing?
And if the answer you think is “no”, what chance do the rest of us have?
I wrote to you recently about what was really happening on the ground here in Australia.
It does seem, given the feedback that came back, we need to continue to explore this area.
This is not just an Australian phenomenon. The same applies to the United States and other large economies.
Let me show you some new research data that you will find very interesting.
With luck, it will leave you with the following stark choice.
You either: build your investment goals around financial news headlines.
Or: trust the 18.6-year Real Estate Cycle instead.
Before you make your choice, let me set out the case for the latter. Because the news is never correct.
Behind the curve as usual, always!
Here are some hard truths.
Central banks have always left interest rates too low for too long, requiring them to change direction and raise them too far, too fast and for too long.
So, you can bake it in, ok? They always get this wrong on the downside and the upside.
Therefore, this insistence on incorrectly applying the bluntest instrument in economics to manage a modern-day economy is a farce. When you are a hammer, everything looks to you like a nail.
Heres what I mean. By the first quarter of 2022, inflation in the US had risen quickly, with certain measurements of inflation recording 40-year highs in March 2022. And yet, at the time, the US Fed was still basically zero-bound in terms of interest rates due to the Covid induced reduction in rates in the zero to 0.25% band.
Belatedly, it decided it needed to act via a 0.25% interest rate increase in March 2022. This formally began the current rate rise campaign that has endured from 2022 to now.
In May this year, it raised rates by 0.25% again for an interest rate band in the 5-5.25% band.
Here’s the reality: inflation in the US is coming down, quite a long way in fact. And fast too.
Measured by producer price inflation (PPI), It’s now almost below 1% (1.1% for May).
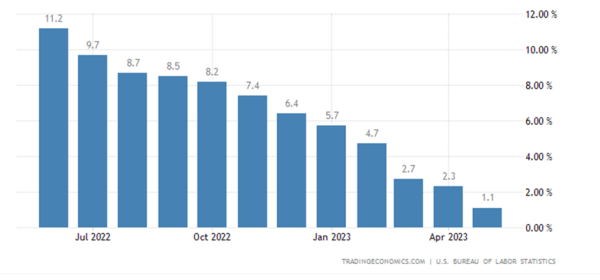
Source – tradingeconomics
And the same dynamic is occurring in Europe now too.
Germany released its producer price inflation (PPI) measure the other day. Its year-on-year growth for PPI is now 1%.
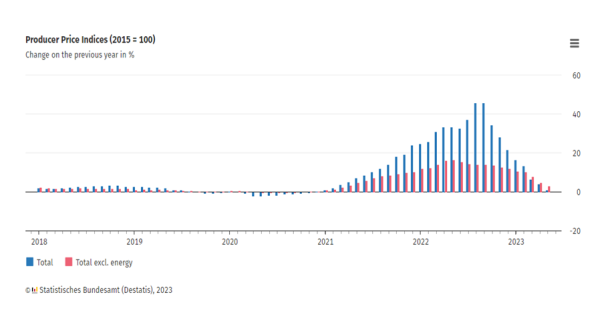
Source – destatis.de
There’s a strong correlation between PPI and the consumer price index (CPI), the measure most favored by economists and central bankers when they try to teach you and me about inflation. Heres a line chart which demonstrates this relationship from a German perspective below. CPI is the green line.
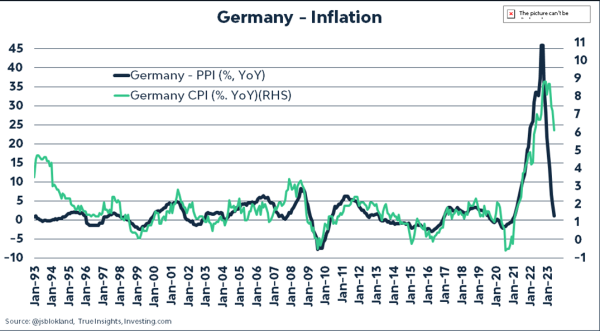
Source – True insight investing.
Bringing it home now, the closest economy to Australia is Canada (resource-based; large property and financial sector etc.; strong links with the US).
What does the latest PPI data say for them?
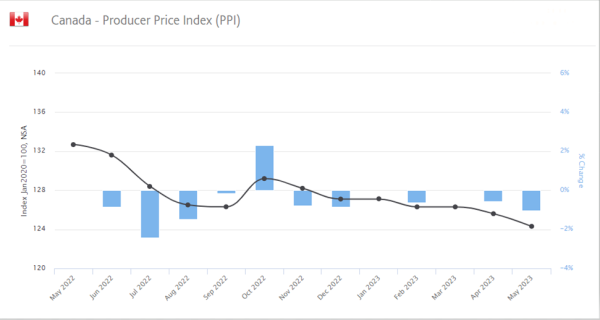
Source – economy.com
Yep, it’s negative! Inflation for the construction sector there has not been this low in years.
This trend now places downward pressure on the TSX (Toronto Stock Exchange) because, as with Australian stock exchange, is heavy on listed mining companies.
The TSX has been falling since its high in April this year and has tipped over again.
But a recent survey by Australia and New Zealand Bank (ANZ) when contrasted against all the above data, is quite revealing.
When relying on the wrong data produces the wrong results.
Let’s play a game now of connect the dots.
Before we do though, once again I ask you, if you haven’t already, to read this recent newsletter here.
That will put into context for you the following.
A recent survey run by ANZ Bank found consumer spending habits for the last 12 months on daily spending on dining/takeaway, groceries, shopping, and travel. The results were then plotted onto the chart below.
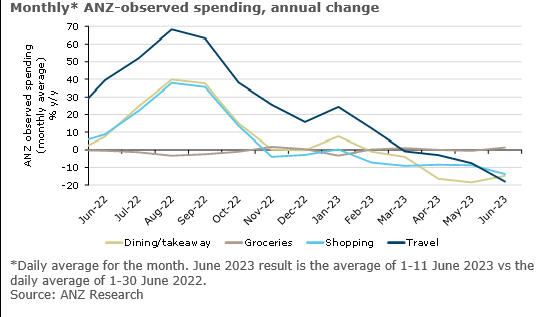
Source – ANZ Research.
Safe to say then that inflation the country is experiencing isn’t being driven by these sectors – going out, shopping, travelling. At least according to the small segment this survey asked.
If you did re-read the above link to my recent newsletter, the inflation in Australia is mostly being driven by things that are essential for a normal existence. What the ANZ survey says to me is that normal folk have worked this out and are deciding to spend less on them.
Either by choice or necessity.
So why is the Reserve Bank of Australia continuing to raise rates when spending and wage inflation are falling? Its now that we overlay the history of the 18.6-year Real Estate Cycle for our explanation.

Where does the history of the cycle suggest we are now? You always start with the US. In the last couple of years, it moved on from its mid-cycle recession lows and commenced the more speculative half of its current cycle.
Which indicates a property boom is beginning, thanks to new construction and infrastructure spending. And easy credit is increasingly available.
Why is this important to note, even if you are not living in the US?
Well, because if you know your cycle history, based on historical patterns, the UK and Australia trail the US by 6 to 12/18 months.
This means that if history repeats, then the current situation in the US can be expected to be happening in Australia, UK and elsewhere in time.
And the latest news out of the US is startling. In fact, thanks to our knowledge of real estate cycle history, we think it is incredibly bullish!
So right now, wherever you may be reading this, the time to prepare is now even if the news is telling you otherwise. Stop wasting time, don’t fall for negative headlines, begin to act.
Here is where you start, via a membership to the Boom Bust Bulletin (BBB). Give me the opportunity to take you in-depth into the cycle.
Learn about the over 200-year history of the 18.6-year Real Estate Cycle and why even today it continues to repeat like clockwork.
It will teach you how to decipher the news that we get bombarded with every day to focus solely on what truly matters.
No more negativity and noise, just the science of the economic rent and the timing inherent in the real estate cycle.
This is all you need to succeed.
The US Fed has paused rate rises for now (although it says that there is the possibility of more to come).
Why? Because inflation is now well within the preferred US Fed’s band. Also, unemployment numbers have risen, which will stop wages growth.
And, as with the chart for German PPI/CPI data, it’s the same in the US.
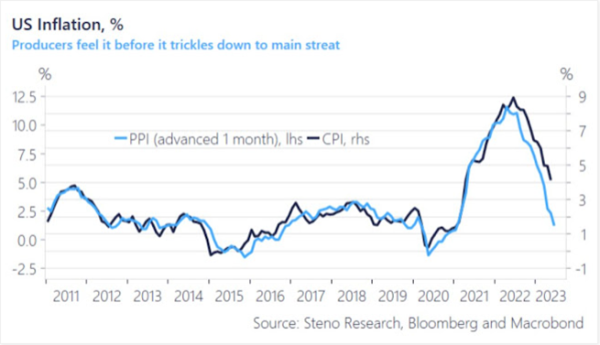
Source – Steno research
Both inflation measures in the US began to fall back in July 2022. Yet the US Fed continued to raise rates precisely 3% higher from that same date! Too far for too long. This was the central point I made to you earlier.
In hindsight, the US Fed had plenty of scope to pause rate rises before now. The inflation trend was very much established and when the tipping point down happened, it was a sustained and quick fall.
Guys, this is the future for Australia. We are simply lagging the much bigger economies in realizing it. This what the history of the real estate cycle, should it continue to repeat, can teach us.
Refer to the above chart: once the tipping point arrived, inflation fell off a cliff! Worldwide the cost of doing business and construction has fallen. Now the US has paused its rate rises.
This development will ripple everywhere.
So, like I said, the time to prepare for what’s coming is now. The second more speculative half of the cycle relies upon massive amounts of credit creation. Now we see a set-up potentially where the US Fed turns to more accommodative interest rate policies.
With a US Presidential election next year too.
All aligned with the timing only knowledge of the cycle can give you.
That’s how the BBB can help.
As a Boom Bust Bulletin member you will receive 12 monthly editions a year detailing all the key turning points of the cycle, a deep dive into the most important markets across the globe and ways that you can personally benefit from this knowledge.
Plus, you’ll receive exclusive invites to BBB member-only webinars when we run them.
Unlike central bankers you’ll have the knowledge you need to stay AHEAD of the curve. When the headlines scream inflation and central bankers panic, you’ll stay calm and make decisions accordingly.
This is all derived from our unique and proprietary research – which you’ll not find anywhere else.
All this for just US $4 a month, less than a takeaway coffee.
Is this an investment you can afford not to make?
Best wishes,

Darren J Wilson
and your Property Sharemarket Economics Team
P.S. – If you would like to receive weekly updates like this, sign up here.
P.P.S – Find us on Twitter here and go to our Facebook page here.
This content is not personal or general advice. If you are in doubt as to how to apply or even should be applying the content in this document to your own personal situation, we recommend you seek professional financial advice. Feel free to forward this email to any other person whom you think should read it.