


If you would like to receive weekly updates like this, sign up here.
A fascinating little report passed my desk recently.
It had lots of info graphs, charts, and plenty of statistics. Now, that might not be your idea of an easy read in your most comfortable chair.
But the devil is in the detail.
Inside this report is evidence of something happening. It directly affects the economy, your work life, and your investment journey for the next 5 years at least.
Now are you interested?
I’ve used these weekly blogs to share and inform you about the financial world through the lens of the 18.6-year Real Estate Cycle.
I know some of you simply label this as my own personal ramblings. And that you need to read or see proof to back up my assertions.
Today I bring it to you: irrefutable and stark.
It’s my genuine hope by the time you invest 3 minutes looking down at your phone, you’ll know what you need to do.
And then look up!
Heavens above, how did you miss that?
So, what exactly is this report I’m referring to?
Why, it’s the Rider Levitt Bucknall (RLB) crane index of course!
One for the connoisseurs I admit, none the less it’s a fascinating read and insight into a true driver of the real estate cycle.
And the reason is quite simple.
It explains so much about what’s happening – on the ground. The type of projects, key industries involved and future infrastructure projects which depend so heavily on the availability of these cranes.
The formula is as elegantly simple as it is important.
The more cranes in operation, the more construction activity. The more construction activity, the higher the demand for construction workers.
And, as you should know by now, the future gains from these projects manifest in higher land prices.
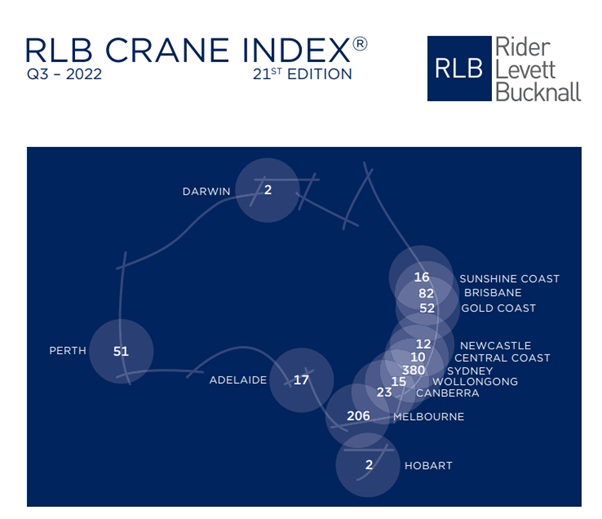
Source – RLB.
According to today’s release of the Q3 2022 RLB Crane Index®, crane numbers across the country rose sharply in the past six months; 300 new cranes were added on developments sites, and 245 were removed.
With the additional 55 cranes, there is now a total of 868 cranes in operation nationally, a new high in the RLB Crane Index® since its inception in 2012.
For the purposes of tracking the cycle in Australia, this report could prove quite valuable.
That’s because of its inception in 2012, which is just after the time our research indicates was the start of the current 18.6-year Real Estate Cycle in Australia.
It’s not perfect, but for our purposes, it is good enough.
Importantly, it’s difficult to argue against what these numbers mean.
The strong growth in crane numbers from this Q3 2022 report appears to correlate with the strong national activity numbers. However, they can also indicate what the headwinds being experienced by these construction projects are.
And it’s the usual suspects. Bad weather, critical staff shortages and lack of building materials.
This is reflected in this report by how long construction cranes remain on site, which results in higher costs for the project.
The fact that over 200 cranes were reported as moved on during the 3rd quarter speaks to these issues slowly being overcome.
This has seen, according to the latest ABS data, construction work done for the 2022 financial year (July 1st to June 30 each year) was up by 1.1% (or $2.4B) across Australia compared to 2021 results.
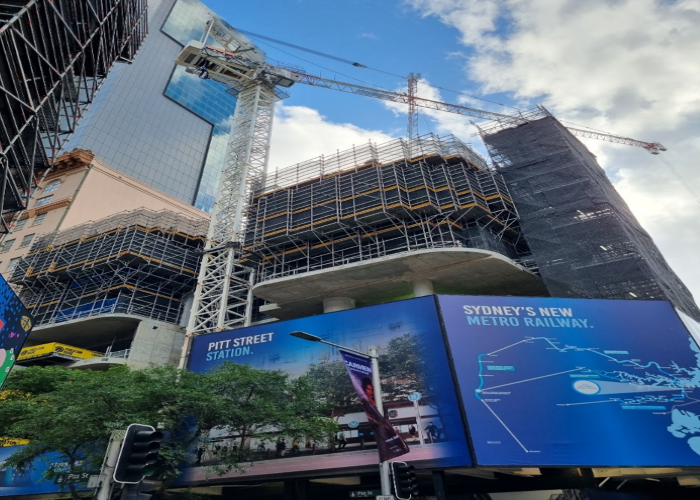
Sydney and Melbourne lead the count. Sydney in particular is striking: it leads the nation in crane counts (43% of all cranes nationally) and today it has the highest numbers ever recorded for the city.
I can attest, I was in Sydney late last year and couldn’t believe how much activity was going on above me. Sydney is building upwards at a terrific rate.
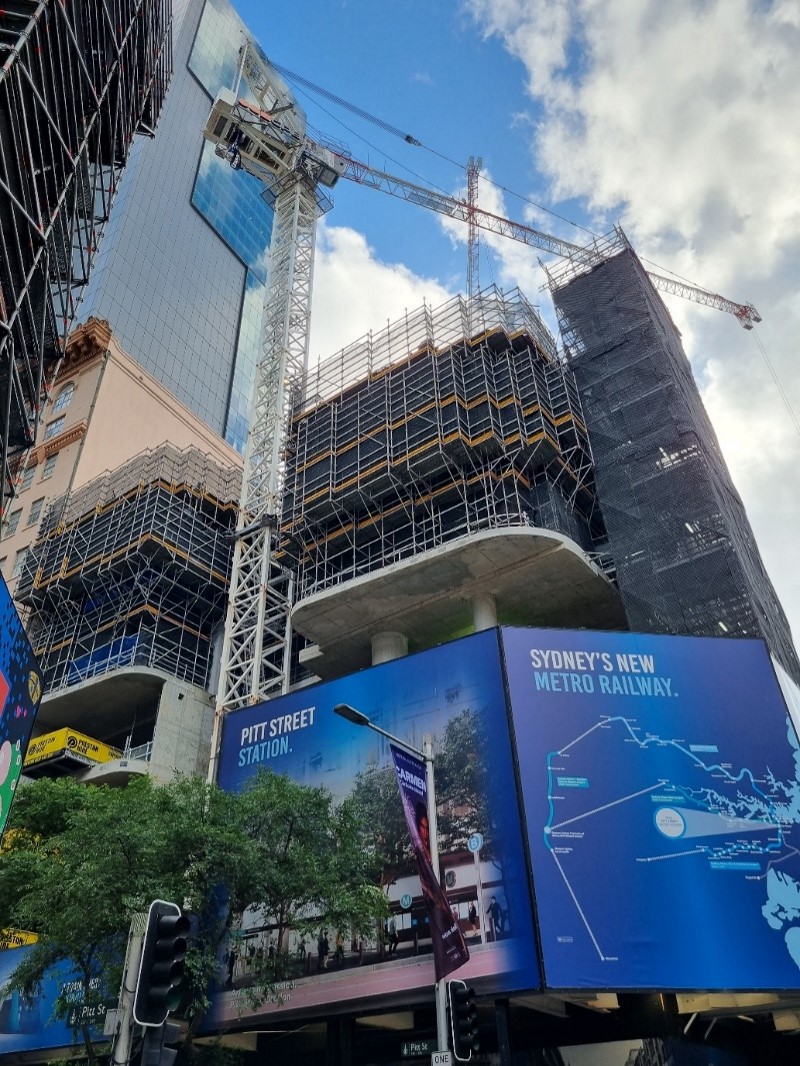
Source – Author
Melbourne, though, is an interesting case study. Traditionally the total number of cranes present in the Melbourne CBD approached 60%. This last recorded quarter this number was down to 43%.
The reason is more cranes are moving away from the city and into regional and surrounding areas. This is a clear sign of gentrification further out.
Sydney is going up; Melbourne is going outwards.
As I said, it’s so straightforward to see what’s happening on the ground by simply counting the number of cranes and where they are.
Australia, as a nation, is absolutely on a construction building frenzy.
It is as the 18.6-year Real Estate Cycle says we should be expecting at this time.
Despite admittingly concerning headwinds faced by most major economies right now.
Regardless, this work “needs” to get done.
So, it is.
Take another look around the skyline where you reside. Are you seeing crane being built that weren’t there before?
If you can’t, I say keep watching, because they are coming.
Here are your opportunities.
I did say that once you read this, you’ll know what you need to do, right?
What did I mean by that?
Again, the premise is simple. All you need to do to begin your research into the opportunities that are present is find out what projects these cranes are building.
And again, our friends at RBL have done the groundwork for you.
The bold emphasis is my own.
“Sydney recorded significant crane number increases in the residential, civic and data centres/industrial sectors. Small increases were recorded in the aged care, civil, education and mixed-use sectors, while the health, hotel and retail sectors remained static.”
If those bolded area represent the demand, guess where I’d be researching to use my investment capital on?
Either via targeting my next investment or commercial property purchase close to future projects exposed to these sectors or finding companies listed on the stock exchange involved in building them.
Melbourne has its own drivers for growth.
“Overall, the rise in cranes occurred in the residential sector, data centres/industrial, retail, commercial, health, recreation and civic. Falls were seen in the mixed-use sector, aged care and within education projects.”
To my mind, these speak to key services across the more regional parts of Melbourne being built to aid in further gentrification efforts for these suburbs.
Each capital city in Australia is building different things, I won’t list them all here.
The playbook is identifying the right infrastructure projects, follow them and buy ahead of the next one being built.
And capture the gains that inevitably follow.
The crane index is a great source, but it’s one of many that can turbocharge your investment journey and place you in the right place at the right time to win big.
Another resource that can help you is the Boom Bust Bulletin (BBB).
It will teach you the history of the 18.6-year Real Estate Cycle and why its repeated over and over for more than 200 years.
And if you are interested in investing with the cycle like I’ve outlined above, then the BBB can give you the key timing you need to know when to get in and crucially when its time to deleverage or get out.
And that knowledge of the timing is literally found nowhere else.
The end of the decade is fast approaching, which means the peak of the land cycle moves ever closer.
The sooner you act, the quicker you learn and apply the knowledge of the real estate cycle to your investment journey, the better.
After all you don’t want to be going all in right when those cranes start running out of work do you!
Best wishes,

Darren J Wilson
and your Property Sharemarket Economics Team
P.S. – If you would like to receive weekly updates like this, sign up here.
P.P.S – Find us on Twitter here and go to our Facebook page here.
This content is not personal or general advice. If you are in doubt as to how to apply or even should be applying the content in this document to your own personal situation, we recommend you seek professional financial advice. Feel free to forward this email to any other person whom you think should read it.